Creating a staging environment for the COVID19 data
Build a datalink which imports the COVID19 daily data files from the John Hopkins University github site into a local database.
Introduction
In this tutorial you will learn how to build an staging datalink, which will pull data files from a github repository and load them into a local database.
Staging is an important step in data management with he purpose being to:
- Centralize where your data are stored.
- Move data away from production systems to avoid performance impacts.
The data that we will be using is the global COVID19 daily data files from the John Hopkins University located here.
Prerequisites
Before proceeding with the tutorial ensure that you:
- Create an account with the Data Experts Integration Hub and install a remote agent to run your data processing. See the getting started guide for more information.
- (Optional) Whilst the github api can be accessed without a github account, there are rate restrictions which may cause errors processing multiple files. If you don’t have a github account then sign-up here.
- Access to a database - You will need to have access to a database to load the data. If you do not have a database, you can use a SqlLite database which is built in and stored as a single file.
Create a Hub
The first step is to create a new hub which will contain all the metadata that we will use run our new data store.
- Login to the integration hub.
- Select Overview -> Hub Management -> New
- Complete the form with the following details:
- Name - Covid19 Data.
- Encryption Key - Click generate random.
- Shared Data Access - Shared data can be accessed any registered user.
- Click “Save”
You should now be directed to the “Hub Remote Agents” section where you will need to authorize your remote agent with this hub.
- Click the remote agent to authorize.
- Select “Is authorized for this hub”.
- Click “Save”.
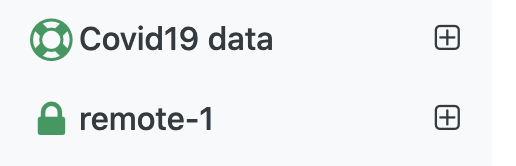
If this is successful you should see the agent and the connected remote agent listed in the left navigation bar as follows:
Create variables to store connection details
Variables are useful for storing frequently used and secure values such as connection details and other environment specific information. Storing this type of information in variables can make migrations between environment (such as development to production).
If you do not have a github auth token, create one at https://github.com/settings/tokens
Navigate to the “variables” section and create the following variables:
| name | value | encrypted |
|---|---|---|
| ManagedServer | {your database server name} | false |
| ManagedUser | {your database user name} | false |
| ManagedPassword | {your database password} | true |
| GitHubToken | {your github personal auth token} | true |
- You can create the username/server name as as encrypted, however the values will not be viewable after they have been saved.
- If you’re using a SqlLite database, enter the full database file path under the “ManagedServer” variable, and ignore the username/password variables.
Create a Managed Connection
A managed connection is a pointer to the database which will be used to store auditing information (such as job execution details) and staging data.
To create a managed connection:
- Select Connections -> Connection > New (Managed)
- Specify the name “Covid Managed”, and select the database type that you will be using.
- Specify:
- Server: ManagedServer variable
- User: ManagedUser variable
- Password: Select use variable, then ManagedPassword variable.
- Click the “Test” button, and confirm there is a “Connection Successful” message.
- Either choose a database form the list, or select “New Database” and create a database called “CovidData”.
- Click “Save”
Create a Source Connection to the Github repository
A source connection is a pointer to a database or file area where data is received from. Source connections are readonly and can not be used as a target in datalinks.
We will be connecting with the John Hopkins University repository to receive the Covid19 datafiles. The repository is located at https://github.com/CSSEGISandData/COVID-19.
To create a source connection:
- Select Connections -> Connection > New (Source)
- Specify the name “Covid Source”, and select the database type “GitHub Flat File”.
- Specify:
- GitHub repository: “CSSEGISandData/COVID-19”
- Secure Token: Select use variable, then GitHubToken variable.
- Click the “Test” button, and confirm there is a “Connection Successful” message.
Import the Covid Daily Files Structure
We will be loading data from the Covid 19 Daily Reports. These are located in the following path: csse_covid_19_data/csse_covid_19_daily_reports.
There are a few things to note about these files:
- The file format has changed as follows:
- Province/State changed to Province_State
- Country/Region changed to Country_Region
- Last Update changed to Last_Update
- The newer files also have additional fields such as Lat/Long/Active etc.
- The field headings and data often have leading and training white spaces which will need to be removed.
Our strategy for dealing these changes will be to create a file format that contains all possible field headings, and then combine them together in the datalink which will load them.
First we will create a custom file format, which will specify that fields need the white spaces trimmed.
- Select “File Formats” -> “New”
- Enter the following details: Name: Trim Fields Check “Trim Fields” & “Trim Headers” Leave other fields default. Click Save
The file structure will be loaded into a “Table”. We can automatically this using a sample file as follows:
- Open the “Covid Source” connection.
- Click the “+ New File” from the menu
- Enter Table Name: “Covid Daily Files”
- Enter Files Subdirectory: “csse_covid_19_data/csse_covid_19_daily_reports”
- For file pattern enter a file with the old format: “01-22-2020.csv” (note this is temporary to allow us to import the column definitions)
- Format Type: “Text”
- For format, select the “Trim Fields”
- Click “Import directly from source”. You should now see columns have been imported such as “Country/Region” etc.
- Change the file pattern to file with the new format: 06-18-2020.csv
- Click “Import directly from source”. You should now see more columns have been imported such as “Country_Region” etc.
- Change the file pattern to: “*.csv” which will load all csv files when loading the data.
Fine tune the column definitions as follows:
- By clicking on the columns and editing where necessary review that the automatically derived data types are correct for:
- “Last Update” and “Last_Update” - DateTime.
- Confirmed, Deaths, Recovered, Active - Int32.
- Other fields should be String.
When finished click “Save”
Create a datalink to load the daily covid files.
A datalink is a “runnable” process that contains rules used to load, transform and deliver data from a source to target. In this section you will create a datalink that loads the Covid daily files into a local database.
Create the staging datalink
To create a default staging datalink:
- Select the table “Covid Daily Files”.
- From the table menu select “New Datalinks (from selected tables)”
- In the new datalinks wizard select:
- Datalink Name: “Load Covid Daily Files”
- Type: “Staging”
- Target Connection: “Covid Managed”
- Audit Connection: “Covid Managed”
- Check “Include source columns in target table”
- Leave other audit columns unchecked.
- Click “Save”
Edit the default mappings:
Edit the datalink:
- If not already opened, open the datalink “Load Covid Daily Files”
- Click “Transforms” and select the “Mapping” transform.
- Expand the “Properties” section, and uncheck the “Allow unmapped input columns to pass through to the next transform”. This will stop the automatic mappings, and means you will need to manually map each required field.
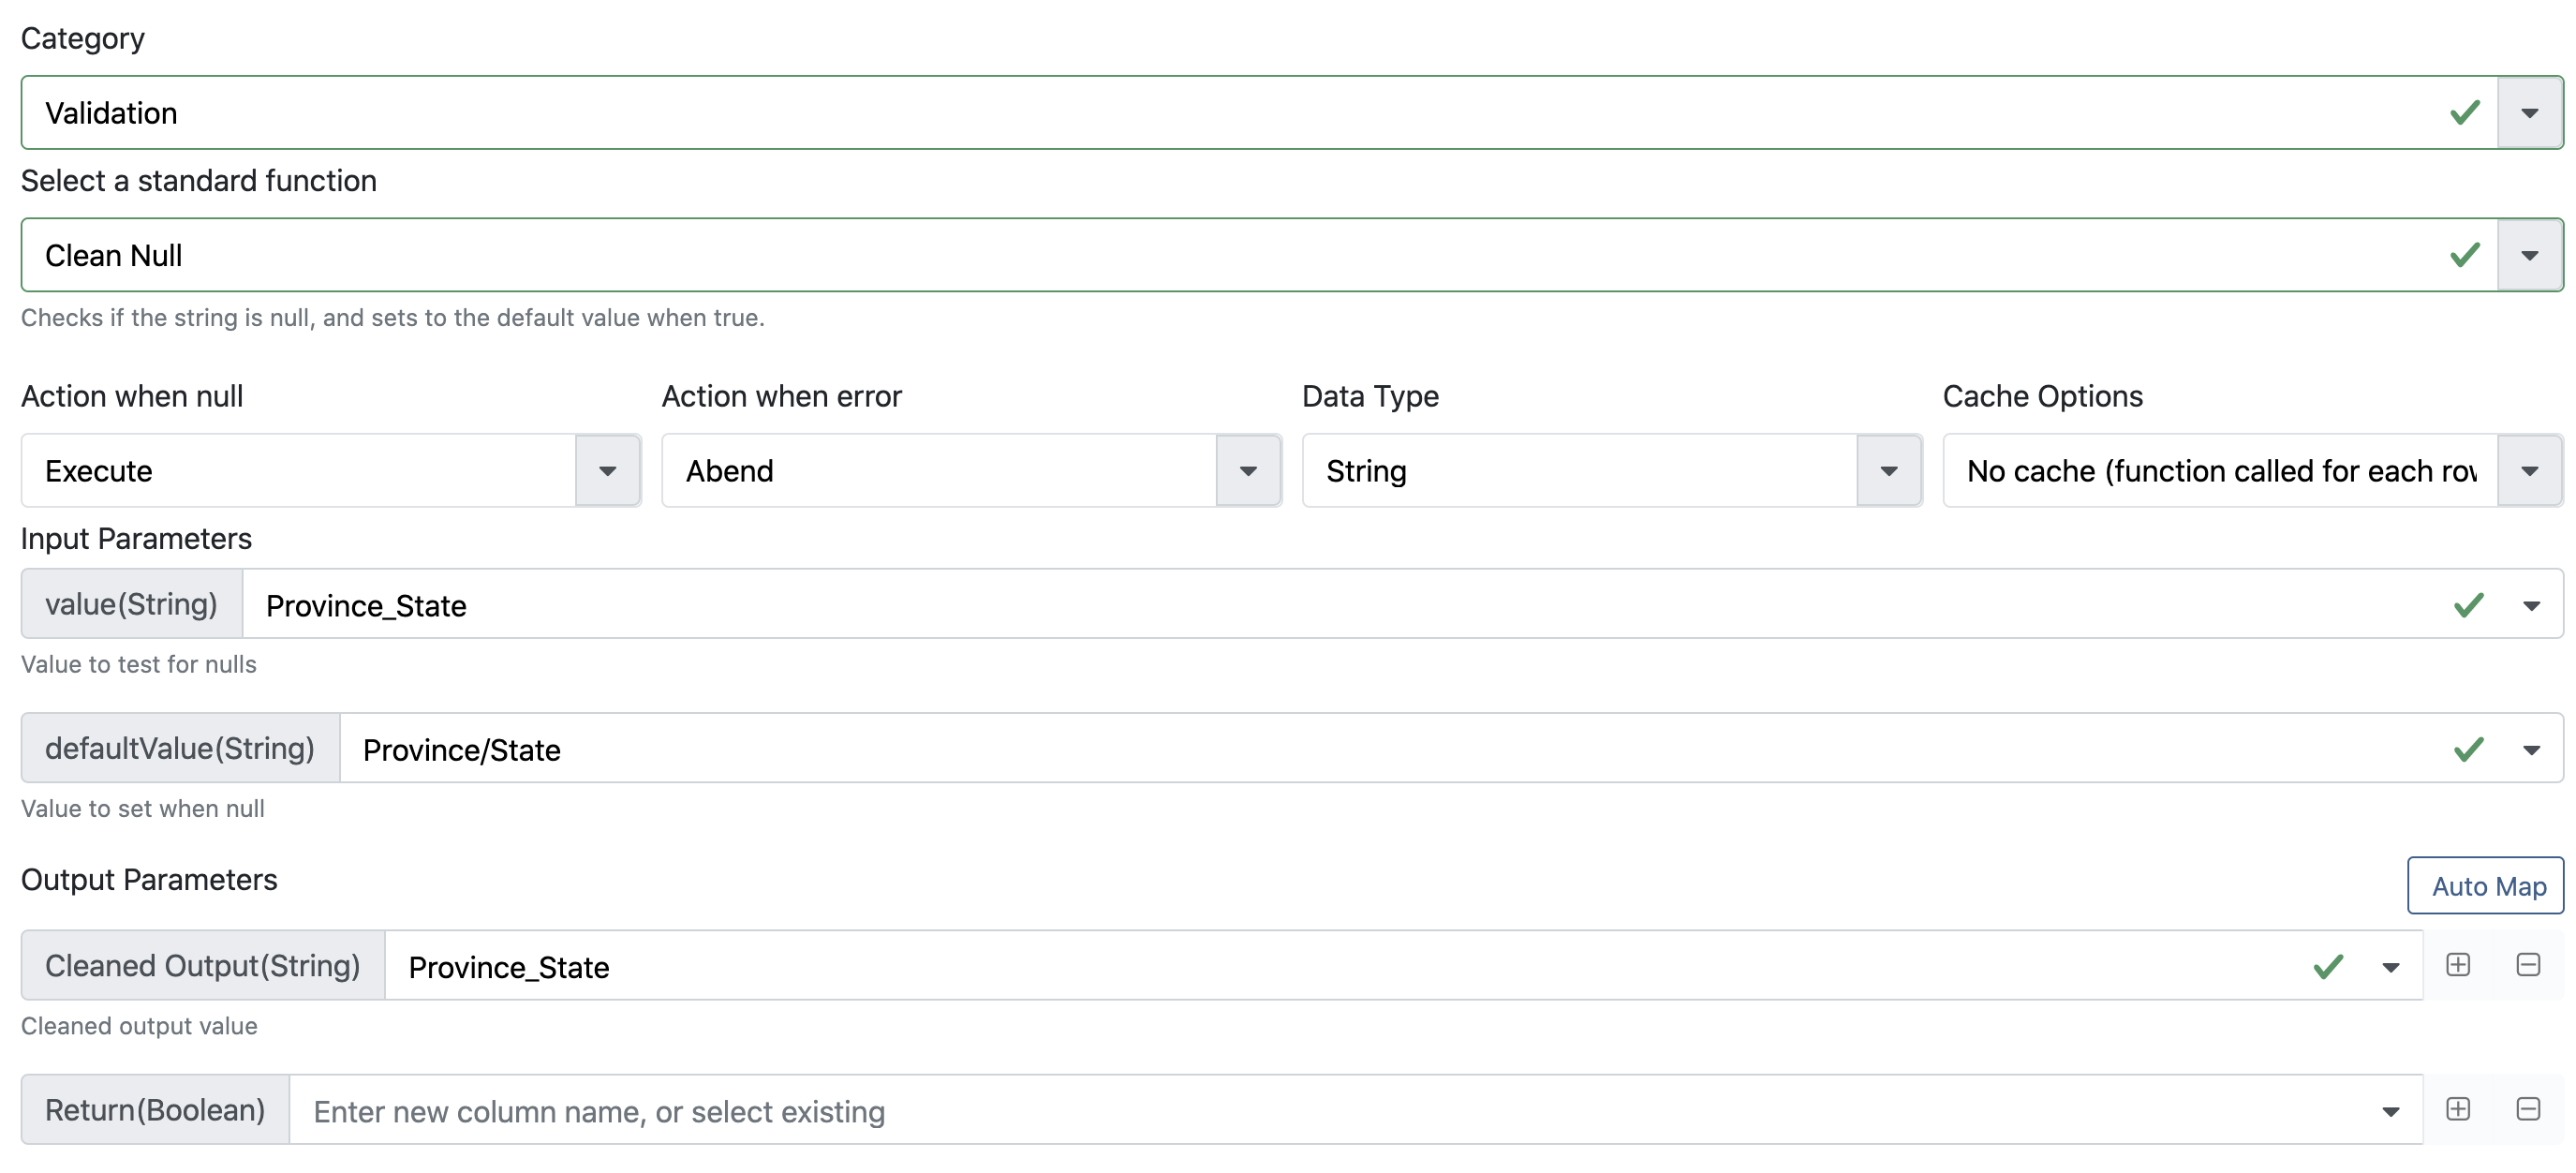
In order to merge the columns with duplicate fields names (such as Country_Region & Country/Region) we can use a standard function called Clean Null. This function checks if a field is null and uses then uses an alternate field. To use this function:
- Click the “Standard” button to open the standard functions dialog.
- Select category “Validation” and function “Clean Null”.
- For
valueselect theCountry_Regioncolumn. - For
defaultValueselect theCountry/Regioncolumn. - For the
Cleaned Outputparameter, select theCountry_Regioncolumn. - Leave the
Returnparameter empty.
The dialog should look as follows:
Repeat the above steps for the columns Province_State and Last_Update columns. For the Last_Update column change the datatype to DateTime.
Next, create standard mappings for the other required columns, by clicking the column under Inputs and drag to the matching column in Outputs. This should be completed for the following:
| Source Column | Target Column |
|---|---|
| FIPS | FIPS |
| Locality | Locality |
| Lat | Lat |
| Long_ | Long |
| Active | Active |
| Combined_Key | Combined_Key |
| Incidence_Rate | Incidence_Rate |
| Case-Fatality_Ratio | Case-Fatality_Ratio |
| Confirmed | Confirmed |
| Recovered | Recovered |
| FileRow | FileRow |
| FileName | FileName |
| FileDate | FileDate |
Note: The Long_ column has a space in the source file, you can clean this up by selecting the mapping and changing the target to Long.
Edit the target table
Click on the “Target” tab. There should already be a default table mapped, which you will need to make some adjustments to.
First, click on this table and expand the Properties, and change the following fields:
- Table Name -
stg_covid_daily_files - Logical Name:
Covid Daily Files Staging - Description:
The staging table for the daily covid files.
Next on the table columns toolbar, click the “Reset All Columns”. This will realign the table columns with the columns that were mapped.
Click “Apply”, then “Save”.
(Optional) Edit the target table column properties
It is a good idea to better describe the output table by editing each column and modifying the following properties. If the fields have better description in the source, they will be persisted when doing other transformations and mappings.
Edit the following properties for columns as necessary:
- Select “Specify a different logical name”, and enter a human readable name. For example change
Last_UpdatetoLast Update. - Specify a description for the field.
Click “Apply”, then “Save”.
Run the datalink
If everything is save, the datalink should now run. From the “Actions” menu, select “Run”.
You should immediately see a progress bar showing the progress. When completed the progress will say finished. You can click on the progress bar to see the statistics of the run, or to review if there is an error message.
Note: Depending on your internet connection and progress speed this might take a few minutes to complete.
Preview the data
To review the data, select “Tables” from navigation bar, select the checkbox beside “Covid Daily Files” table (the one with the Managed connection), and from the table toolbar, select “Preview Data”
You should now see the first 100 rows of data. To filter the data by a country:
- Click “Add Filter”
- Select “Country/Region” =
US(Note, you need to typeUSmanually, as only columns, not values are listed in the dropdown). - Click the Refresh button.
Continue to review the data to ensure that the mappings look correct.